
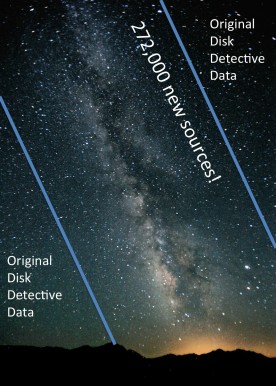
Good News Everyone! 272,000 More Subjects
January 28 we launched DiskDetective with a first batch of about 32,000 sources to classify. Of these, 20,000 have been in rotation at any given time. That’s a lot of astronomical data–and a lot of flipbooks to look at.

Well, it completely shocked us when we heard in March that some folks were seeing repeats–meaning that they had already classified more than 20,000 subjects! Now, we had always planned to have many more subjects than that in Disk Detective. But at that point, we were still in the process of downloading the data from the NASA/IPAC Infrared Science Archive onto a hard drive on Marc’s living room carpet, a process that took about a month. So we weren’t ready to put any more data online to keep all our detectives detecting.
The figure below shows the distribution of the J magnitudes of the sources with excess emission at 22 microns that WISE made really high quality images of (specifically ones from Southern Galactic latitudes, but that doesn’t matter). The total distribution, shown by the black curve, has two peaks, one around J=9, the other around J=16.
What is the meaning of these two peaks? Could it be two different kinds of sources?
The red and orange curves tell the rest of the story. The red curve shows the numbers for just those sources close to the Galactic plane. The orange curve shows the numbers for the remainder of the sources–those far from the galactic plane. Dividing the sources up in this manner shows that the second peak is mostly due to distant galaxies.
At low galactic latitude, dust from our Galaxy, the Milky Way, obscures most galaxies external to our own. So we know that the objects shown by the red curve–most of the peak at J=9–are stars (and maybe stars with disks). At high galactic latitude, the opposite is true. The objects shown by the orange curve should be mostly galaxies. That’s the peak at J=16.
For now, we’d like to skip the objects that are mostly galaxies (orange curve) and concentrate on the objects that are mostly stars (red curve). The orange and red curves cross at about J=14.5, so we decided to put aside the objects with J > 14.5 for now. That means this new batch of data should have fewer galaxies in it than the old batch–and more of those delicious disks!

What are we doing with the sources with J magnitude >14.5? Don’t worry, we’ll be putting them to good use. Our colleagues have suggested that hidden among those fainter sources could be Kardashev Type II and Type III civilizations. So once we’re done with this new batch of sources (roughly in 2017), we’ll start looking at the fainter objects–looking for signs of extraterrestrial intelligence. In fact–you may have already spotted some in the first batch of data. (They look just like debris disks and very red galaxies). Stay tuned!
