
That’s no moon…
A very common question here in Disk Detective is, hey, is that a planet? A disk? A moon? Those are exciting things to think about. Let me skip to the punch line: no, sadly, we can’t see planets, disks, or moons in the Disk Detective images. But let’s talk more about distances and angles, and I’ll try to better explain what we can and can’t see.
From this earlier post, we know that the overlays on the images in Disk Detective, in units of arcseconds, are :
- Red Crosshairs: 2.1 arcseconds across
- Red Circle: 10.5 arcseconds radius
- Disk Detective image: 60 arcseconds across
(If you need a refresher on what an arcsecond is, try this post from another site.) The overlays aren’t the only thing with angular scales that are important here. The original pixels in the DSS are about 1.7 arcseconds; the pixels in 2MASS are about 1 arcsecond, and the pixels in WISE are about 1.4 arcseconds.
OK, so physically, what do all of these angles mean? We could start with something at least somewhat familiar — the Moon is about half a degree in diameter, or about 30 arcminutes. Here is a post from another site that has lots more good information tying angles on the sky to familiar objects (like your finger).
Now, let’s start applying these ideas. The stars that are in Disk Detective appear to be relatively large on the screen. But are they really that large on the sky? Proxima Centauri, the closest star to the Sun, is about 4.2 light years away. In 2002, the VLT measured the diameter of this star to be “1.02 ± 0.08 milliarcsec, or about the size of an astronaut on the surface of the Moon as seen from the Earth (or a head of a pin on the surface of the Earth, as seen from the International Space Station).” (quote is from the press release in the link.) Let me emphasize this: MILLIarcseconds, so about 0.001 arcsecond. The Disk Detective crosshairs are 2.1 arcsec, and the pixels in those images are between 1 and about 2 arcseconds. Proxima Cen is the closest star to us, and it is a fraction of a fraction of a pixel in the Disk Detective images. We can’t typically determine sizes of other stars with most of our current instrumentation. The only people who can get the sizes of other stars right now are people who use optical or infrared interferometers, and only for targets that are relatively close and relatively bright. So the stars in Disk Detective only appear to be measurably large on the image, because of the way that the telescope+detector responds to the source of light.
Let’s go further, and put an imaginary disk around Proxima Cen that is the size of our Kuiper Belt. Making some simple assumptions, I get that it would be about 30 arcseconds across, so half the size of the Disk Detective image. But it would be impossibly faint at all of these bands, very difficult to see in these relatively shallow images (by which I mean ‘short exposure time’ such that we only see the brighter things). And we are still working with just the very closest star.
A relatively nearby star with a real (not imaginary) disk is Beta Pictoris, at about 65 light years away. This star is also impossibly small compared to the pixels here. Its disk, though, is ENORMOUS, 5 times larger than our Solar System. I get that it is about 102 arcseconds across, larger(!) than our Disk Detective images. BUT, it too would be impossibly faint, very difficult to see in these relatively shallow images, and in fact unless you found a way to block the light from the central star, it would be impossible to find the disk. This is what astronomers really do – we have a special shade that blocks out the light from the central star so that we can stare for a long time and collect light just from the disk. Planets (or Moons for that matter) are far, far fainter than the disk, and we still need to block the light from the central star (and make some good wavelength choices to maximize the brightness of the planet compared to the star/disk). Even when we do that, though, one of the planets found in Beta Pic’s disk is 0.4 arcseconds away from Beta Pic. …Aaaaand, now, we’re back to fractions of pixels in Disk Detective, even if we could block the light from the central star.
And it gets worse! There is this blog post on issues of spatial resolution in Disk Detective. The WISE spatial resolution is ~6 arcseconds. SIX ARCSECONDS. When you get to 22 microns, it’s TWELVE ARCSECONDS. That means that if two things are 12 arcseconds or less, WISE at 22 microns can’t tell that there are 2 objects. (That’s why we ask you in Disk Detective to indicate if you are seeing 2 objects in the shorter wavelength images.) The rest of WISE can’t tell if there are two objects that are 6 arcseconds or less apart. The spatial resolution of the DSS and 2MASS is closer to 2 arcseconds. So pixel size is rapidly overtaken by spatial resolution issues at the longest wavelengths, where the disk is brightest.
 At 25 light years, Fomalhaut is another relatively nearby star that has a disk. The Herschel observatory snapped a picture of it, but its eyesight (at longer wavelengths) is about 3-4x better than WISE at 22 microns. The dust’s light is also dependent on its temperature–cold dust will glow more brightly at longer wavelengths. Dust that is bright at 22 microns is typically much closer to a star. Even in the most optimistic case where you have a bright extended disk like Fomalhaut, it would barely peek out from behind the edges of the WISE “blob” (the response of WISE to the light from the unimaginably small point of light that is the star), shown in the upper left hand corner of the figure–the pictures of Fomalhaut as it looks at 25 light years and 160 light years are shown on the lower right of the figure, to scale on the sky with the WISE 22 micron PSF. See? Waaaay too small to be seen with WISE. And, at 160 light years, too small for Herschel too.
 What might WISE see with Fomalhaut? Using a rough model of the Fomalhaut disk and smearing it out with the WISE PSF, it might look like this, provided the entire disk was just as bright as the central star at 22 microns. BUT that is not really the case for Fomalhaut–the disk is at least ~40x fainter than the star at that wavelength. And it gets worse – most of the emission from Fomalhaut at about 24 microns does indeed come from a cloud close to the star; that part is 10x brighter than the total outer disk flux, but that’s still much fainter than the star.
But, wait, you say, you know you have seen pretty pictures of disks before in the media! Well, sometimes those are artist’s conceptions, where we are inferring the presence of disks from the excess of emission in the IR (“more IR than we think there should be”). Sometimes they are models of what people think these things must look like. None of the gorgeous images are from DSS, 2MASS, or WISE. And, yes, there are four famous disks that are nearby: Vega, Fomalhaut, β Pic, and ɛ Eri. Nearly all of the great images are of these four. There are another 8 debris disks that are further away than these closest four, but close enough that we stand a chance of getting images of them, so you may also have seen images of one of these 8. But there are only a total of 40 or so debris disks that are close enough that our current instrumentation can distinguish a disk from the central star, and sometimes it’s just barely distinguished, even when using the best tools available. And, especially then, it sure doesn’t look like a ring.
Distances to these objects matter, a LOT. The overwhelming majority of stars in Disk Detective are much, much further away than these 4, 12, or even 40 closest debris disks. The closest ones in Disk Detective are most likely at the very best 300 LY away. Even if we put a Kuiper Belt around such a star, it would be less than half a pixel across. Even if we put an ENORMOUS disk, like Beta Pic’s, around such a star, it would be about 2 arcseconds across, comparable to the size of a pixel in Disk Detective (and still impossibly faint compared to the brightness of the star). Remember that planets or moons are far, far, far fainter than the disk, and usually closer in than the full extent of the disk. So there is just no way that we can see planets or moons in the Disk Detective data.
If you find something that appears in the images of a target you’re looking at, and it is beyond the radius of the red circle, how far would it be from any given target? The circle is at 10.5 arcsec, and most of the questions I’ve seen on this topic are finding objects outside of that circle radius, so let’s call it about 20 arcsec. In the best case of our target being a star (1st assumption) that is 300 LY away (2nd assumption), and that the second thing is also a star (3rd assumption) at the same distance (4th assumption), that second thing is 0.03 light years away from the target object, or 45 times the size of our Solar System. That’s not a reasonable size for a disk around a star, much less a planet. And this is the best possible case, for the closest star in Disk Detective — most of the stars are much further away.
Disks and rings are MUCH smaller in size than the smallest detail that WISE can see at long wavelengths. Every known circumstellar disk is unresolved with WISE, including Beta Pic and the other 11 of the closest stars with disks. And if we can’t see rings or planets around these stars, we certainly can’t see moons around the planets, which are generally smaller than the planets. For example, the Earth’s moon is just about the size of the state of Texas–much smaller than the Earth.
The other objects that appear in the Disk Detective images, even within the circle, are other stars or galaxies that just happen to appear in the images. The chances of them being associated with each other (even as a binary star system) are extremely, extremely low. And they are not planets or moons around these stars.
Lots of people want to image disks and planets, though, and lots of people, especially at NASA, are working towards that goal. We are looking for new disks all the time, and using existing instrumentation where we can to image disks. But to get lots more images of lots more disks, we need special instrumentation (much of which is still being designed, including at NASA), we need to be observing at the right wavelength (e.g., pick one at which the disk or planet is likely to be as bright as possible), and have the star+disk be close enough to us that we can resolve it. The limits for “close enough” are moving out further and further every year as we develop more and better instruments to look for these things.
— @lrebull with help from @johndebes, @marckuchner, & D. Padgett
Our First Follow-Up Observing Proposal
Barely a week after the launch of DiskDetective, I looked at the calendar and saw an important deadline looming: the deadline to propose for time on the telescopes at the Fred Lawrence Whipple Observatory (FLWO). The FLWO is a cluster of telescopes nestled into the rocky terrain at the peak of Mount Hopkins, about an hour south of Tucson, Arizona. Among this group of telescopes is the 1.5m Tillinghast, which our science team members Thayne Currie and Scott Kenyon have used in the past for spectral typing large sample of stars—the perfect machine for some initial follow up of our Disk Detective candidates.

The telescopes are scheduled by trimester, so there are opportunities to propose once every four months. But filled with excitement from our launch, and all the interesting candidates you have been discussing up on Talk, I was suddenly eager to jump on this chance to take our disk search to the next level. So I emailed the science team and we all started writing.
Proposing for time on a telescope generally means preparing a four to six page document (the proposal) and submitting it to the Time Allocation Committee (TAC). The TAC, a panel of astronomers who have experience using the telescope at hand, compares all the proposals the receive and decides how many nights on the telescope to award each one. The telescopes are always oversubscribed, so the TAC generally has to disappoint many of the teams that propose, awarding them fewer nights than they ask for, or maybe none at all.
In any given proposal round, the Hubble Space Telescope is usually oversubscribed by a factor of four to one. The brand new ALMA telescope was recently oversubscribed by a factor of nine to one! But the 1.5m TiIllinghast is only oversubscribed by about 1.5 to one, so it seemed like there is a good chance we will get some observing time to test our ideas, if we could somehow get our act together in a flash.
The proposals generally consist of a list of targets, a description of the observing procedure and how the data will be analyzed, and a few pages explaining why the work is important (the “Science Justification”). Each section must be perfect if it is going to impress the TAC. With only three days to go, John Debes and I started passing around a draft of the science justification section. Thayne Currie and Scott Kenyon chimed in on the observing procedure and data analysis sections.
The concept of the proposal was simple. Many of the good candidates from Disk Detective (clean, uncontaminated point sources whose spectra energy distributions look like a star plus a disk) are stars that we know very little about. We may know how bright they are in one or two bands, or even have a crude spectrum. But for a disk candidate to be useful to help us understand how, where, and when planets form, we need to know more than that.
We need to know whether the star is on the main sequence like the Sun, whether it as a young star like HH 30, or whether it has evolved off the main sequence, like the red supergiant Betelgeuse. We need to know the star’s mass—stars range in mass down to less than one tenth of the Sun’s mass, and up to maybe 100 times the Sun’s mass. And of course, we need to be certain that the object we think is as star is not really a galaxy or AGN. The observations we had in mind can help fill in all this information by telling us the “spectral type” of the star.
The 1.5m Tillinghast telescope (the 1.5 meters refers to the diameter of the first mirror that the starlight hits) comes with your choice of two different spectrographs. We opted to propose for the FAST spectrograph, which provides spectra with a moderate level of resolution, but has a very high efficiency, so we will have time to take spectra of maybe 50 stars per night. If you’re used to looking at the SEDs of your favorite object, you can think of these spectra as filling in some of the fine details in the SEDs in the wavelength range around 0.4 to 0.7 microns. The fine details will show us absorption lines (dips in the spectrum) associated with various elements in the star near its surface. The widths of the lines tell us about the star’s mass. The relative strengths of the different lines will tell us the star’s temperature. With a bit of additional modeling, we can also learn about the amount of each element present in the star and even constrain the star’s age.
So the concept was straightforward, as far as these things go—business as usual for astronomers who study stars. What was scary about writing this proposal was the target list! We didn’t need to make the final selections just yet; if we win the telescope time, we will be allowed to submit the final list later on. But at this point we had to understand going in what kinds of targets were available if we were going to write something reasonable. Alissa Bans started digging through the data from the Disk Detective classifications and quickly got stuck; there was already just too much data from the more than 250,000 classifications we had already received to sort through and comprehend in one weekend. I thought for a bit that we were going to have to give up, and wait till next round.
Fortunately, at the same time, the Disk Detectives were submitting their favorite objects on the Talk pages, checking the RA and Dec in SIMBAD to make sure they were in the right part of the sky for this telescope to observe in the spring trimester, checking the V magnitude to make sure collecting a high quality spectrum wouldn’t take too long, and checking the literature to make sure they had not already been classified. In about 24 hours, we had lists of good targets from Pini2013, TED91, onetimegolfer, artman40, silviug, WizardHowl, Vinokurov and others. These lists gave us a notion of how our target options were distributed in terms of observability and what was known about them. And the mere fact that y’all were able to come up with these lists of good targets made us confident that the proposal was worth submitting, even in such a rush.
Tuesday morning, Scott Kenyon uploaded the finished proposal onto the proposal submission website. In a few weeks, the TAC will make its decision. With any luck we’ll be awarded a night or two of time to start following up our objects.
If that happens, none of us will actually go to Mount Hopkins. Instead a technician who is an expert at the ins and outs of this particular telescope and instrument will stay on the mountain and do the observing for us (that’s how they do it at this telescope). In fact, all our targets won’t even be observed in the same night. They will be mixed in with other targets all throughout the spring months, based on the weather and what’s convenient to point at. But we will start getting emails with lots of juicy new data for us to analyze on our favorite candidates.
So thank you again for all the hard work last weekend poring through the data and literature. The process gave us a chance to try out the next stage of the Disk Detective project and better understand what we’ll need to do to find the valuable new disks we’re looking for. And this first telescope proposal is just the beginning—so don’t worry if you missed it. The next opportunity for the FLWO 1.5m will be June 18. We are also looking into opportunities to proposal for time on telescopes in the Southern hemisphere so we can observe objects below the equator (declination <0). We’ll let you know about these as they come up.
There is nothing like first-hand evidence.
Why Do The Stars Seem To Grow At Longer Wavelengths?
The images you see in Disk Detective generally seem to get bigger and blurrier at longer wavelengths. You might be wondering: why does this happen? Or you might be wondering: even when you are looking at a single tiny, tiny star, the image you see in Disk Detective is never a perfect single tiny, tiny dot on your screen. Why is that?
The answer to these questions has to do with what happens to the light from a star on its way to the detector to make the image that you see. Before it can land on the detector, the light from a star (or galaxy or asteroid, etc.) first hits the Earth’s atmosphere, then the telescope mirrors. When it hits those objects, the starlight gets altered in ways that affect the final image.
When the starlight hits the atmosphere, the atmosphere tends to scatter the starlight in different directions. It’s a bit like looking into a swimming pool full of water; if there are lines on the bottom of the pool, they end up looking a little wiggly even when they are actually straight because of the waves on the surface of the pool. Waves in between layers of the Earth’s atmosphere do the same thing to the light from our stars. This subject clearly shows the effects of atmospheric distortion–affecting multiple stars in the same way.
When the starlight hits the telescope, it scatters some more, and also diffracts. The diffraction occurs when the edge of the telescope blocks some of the incoming wave of light, and so the rest of the light wave tends to bend around that edge. That process also affects the final image we see. Both diffraction and scattering get more severe at longer wavelengths of light. That’s because as the wavelength gets longer, the light behaves more and more like a wave (bending and dancing), and less like a particle (direct, like a bullet).

Diffraction
Now, the images you see in each flipbook on Disk Detective come from three, sometimes four different telescopes. The WISE telescope is in space, so the images are blurred mainly by diffraction and scattering within the telescope. The other telescopes on the ground (DSS, 2MASS and Sloan), so the images are blurred by diffraction and scattering inside each telescope—and also scattered by the Earth’s atmosphere. As a result, each telescope yields a different angular resolution as a function of wavelength.
Angular resolution is another way of referring to the size of the smallest image a telescope can produce given diffraction and scattering—the size of a tiny, tiny star as seen by this telescope. Here are the angular resolutions of some of the telescopes whose data you’ve been looking at:
- DSS at 0.4 microns: 1-2 arcseconds
- 2MASS at 1.6 microns: 2-3 arcseconds
- WISE at 3.4 microns (W1): 6.1 arcseconds
- WISE at 22 microns (W4): 12 arcseconds
When it comes to angular resolution, smaller numbers are better. The worst angular resolution in DiskDetective comes from WISE at 22 microns. That’s because light at this long wavelength scatters and diffracts very readily. Also, diffraction is worse in small telescopes, and WISE is the smallest telescope of the bunch. Here are the diameters of the primary mirrors (the big mirror that the light hits first) in the telescopes we’re using.
- Palomar Oschin Schmidt Camera (DSS): 1.2 meters
- 2MASS: 1.3 meters
- WISE: 0.4 meters
Now, diffraction and scattering are not the only phenomena that affect how a perfect star looks in the Disk Detective images. Sometimes, as we discussed a few days ago, the stars are so bright that they saturate the detector, and appear bigger than the angular resolution of the telescope would suggest. Photon noise and detector noise are also important, especially in 2MASS data. We’ll come back to that in another article!
So remember: some of the objects in DiskDetective may indeed be bigger at longer wavelengths. But every object in DiskDetective will tend to look bigger at longer wavelengths anyway because of how diffraction and scattering cause the images to blur.
“They say that genius is an infinite capacity for taking pains. It’s a very bad definition, but it does apply to detective work.”
The Power (and Danger) of SIMBAD
If you click the keyboard icon to “Discuss on Talk” one of your favorite subjects, you’ll find a page with a button “More Info on SIMBAD”. This button takes you to a powerful database, the “Set of Identifications, Measurements, and Bibliography for Astronomical Data” run by CDS, the Centre de données astronomiques de Strasbourg in France. But like many powerful tools, this one takes a bit of care to use, so I thought I’d offer some tips.
The first thing you need to remember about SIMBAD is that–wonderful as it is–it’s far from perfect. Indeed, if SIMBAD contained everything we needed to know about every object in the sky, we wouldn’t need to do any more astronomical research!
For example, as I’m writing this article, SIMBAD contains about 7.4 million objects. That’s a lot of sources. But for example, the WISE mission found about 747 million objects: 100 times as many as there are in SIMBAD. Looking at those numbers, you might get the impression that most of the time, when you click the “More Info on SIMBAD” button, you’d draw a blank. But it’s not that bad; we pre-selected objects for DiskDetective that are relatively bright, so the overlap with SIMBAD is pretty good. But it is pushing the limits.
So what does SIMBAD do when we ask it to tell us about a DiskDetective object? It takes the coordinates of the object and searches a region of the sky around those coordinates. If the search turns up a single object, it shows you the page for that object. If the search turns up multiple objects, it shows you a list of the objects. And sometimes the search comes up empty, and tells you “No astronomical object found.”
So when SIMBAD shows you a list of object, you’ll want to look at the column called “dist(asec)”. That tells you how far away on the sky the objects in the list are from the DiskDetective object, measured in arcseconds. Since you might not be used to this jargon (“arcseconds”), here are the sizes of a few things in DiskDetective for comparison, in units of arcseconds:
- Red Crosshairs: 2.1 arcseconds across
- Red Circle: 10.5 arcseconds radius
- Disk Detective image: 60 arcseconds across
So if you see a list of objects on SIMBAD, and one is 100 arcseconds away, then that object probably doesn’t even appear entirely on the screen–though if it’s a bright object (and objects in SIMBAD often are) you might see some artifacts from it leaking into your field of view. Of course, the coordinates in SIMBAD aren’t perfectly accurate, either. It’s not uncommon to see errors of an arcsecond. So you can get a good general mental map of where things are from SIMBAD, but you can’t expect things to line up perfectly. OBut crucially, if the SIMBAD object is less than 10 arcseconds away, it’s likely in your red circle.
SIMBAD contains other kinds of gotcha’s. For example you might see an object in SIMBAD labeled “2dFGRS TGS224Z188 — Galaxy” and you’ll figure that what you’re looking at has to be a galaxy. These classifications are right most of the time. But they are also far from perfect. For faint objects, the classifications might be based on astronomical images that are subject to substantial amounts of noise, for example.
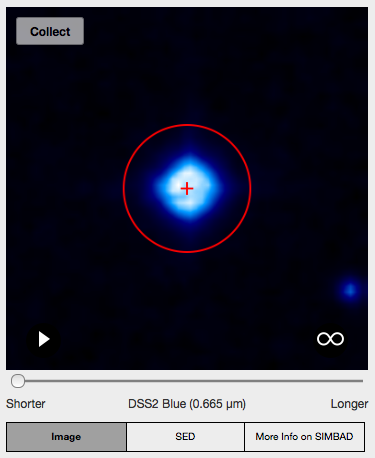 So what’s SIMBAD good for? Well, if your DiskDetective object is relatively bright, e.g. it looks like the image is saturated like the depicted here, or surrounded by its own diffraction spikes, then it will probably give you a reliable classification in one shot. You can quickly find out if your object is a star–and crucially, find out if it’s a star with a known disk! Just look at the “References” on the SIMBAD page, and you can browse the literature on the object, and check for papers about Debris Disks or Herbig Ae stars or T Tauri stars for example. If you do find an object with a known disk, mention it on Talk! Because then we all get to do a little jump for joy, because it shows DiskDetective is working as it should.
Then, once you have discovered a fainter good candidate on DiskDetective and checked the location of the SIMBAD object (e.g. from the “dist(asec)” column), and you’re sure it’s in your red circle, you can use SIMBAD to tell you lots of interesting information about it. For example, the “Gal coord.” on SIMBAD are the Galactic Coordinates. They tell you where your object is on the sky compared to the Galactic plane; the second coordinate tells you how far from the plane it is (from 0 to 90 degrees). Disks are often clustered into groups–and one goal of DiskDetective is to find more of these groups based on the coordinates and the proper motions, also listed in SIMBAD. (We’ll talk more about that later!)
SIMBAD also sometimes lists measurements of how bright an object is at wavelengths we don’t normally include in DiskDetective. These can help us improve the SEDs we have–once we have found a good candidate. (We’ll get into that later too.)
We included the SIMBAD links because while you’re doing your detective work, SIMBAD can give you some useful clues. It may even help you come up with your own research ideas. Just remember that ultimately, your goal as an astronomer is to improve and augment the data in SIMBAD, not to trust it blindly.
“I never guess. It is a shocking habit,—destructive to the logical faculty.”
Marc Kuchner
@marckuchner
Spectral Energy Distributions (SEDs)
@ geckzilla asked on Talk:
I’m unfamiliar with SED diagrams. Could someone give me a few pointers? I read the short paragraph on the science page so I get the gist but I was wondering what some specific examples as they pertain to this project might look like.
SEDs are an important tool for recognizing and understanding disks. So I thought I might copy over here the answer I put there, and expand on it a little.
SED is an acronym meaning “spectral energy distribution”. So, it tells you where the energy is coming out as a function of wavelength (that’s the spectral part) from the combined light of whatever you’re looking at. By plotting up the energy emitted by an astronomical object, we can compare at a glance the emissions across a broad range of wavelengths. Does most of the energy come out in the UV, optical, or in the IR? The answer to that question can tell us something about what the object is.
For Disk Detective, we hope what we are looking at is {star+disk+anything else nearby including background sources} but it may very well be the combined light of a galaxy. The bands shown in Disk Detective come from optical (SDSS, DSS), near-IR (2MASS), and mid-IR (WISE). You can make an SED out of whatever photometric or spectral data you have on any given object (as long as the data are calibrated).
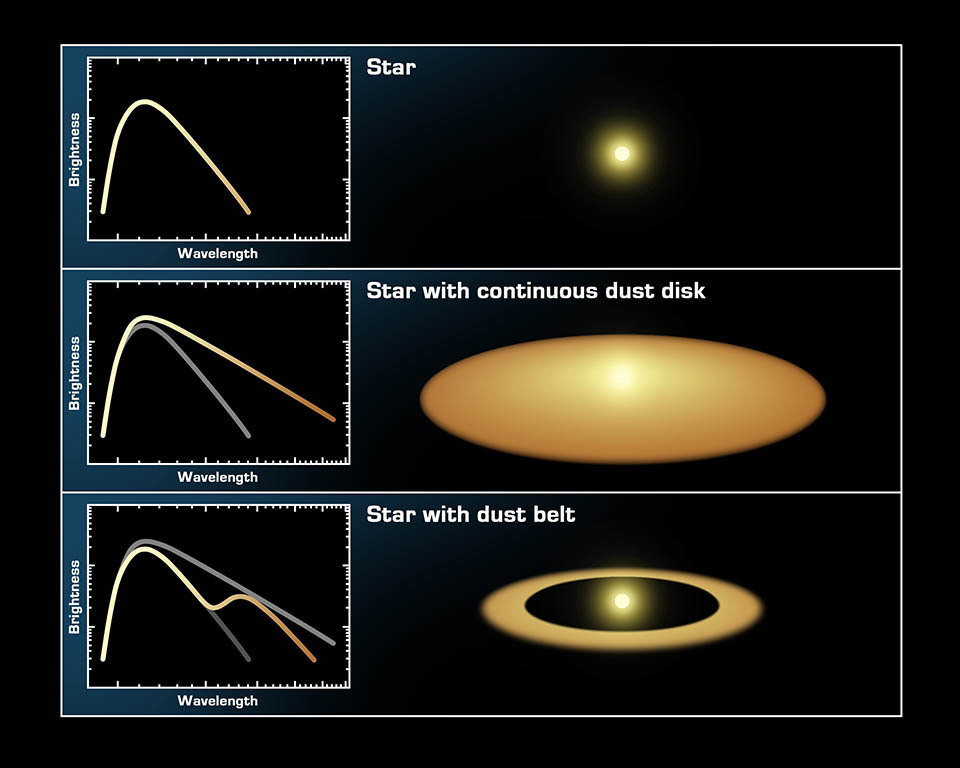
Stars without disks will look something like what physicists call a blackbody. That’s the top panel in the figure above. There is a mathematical description of this shape, but basically it describes the energy coming out from anything that is glowing due to heat – you, your toaster heating elements, an incandescent bulb, etc. The amount of energy emitted by an object at all wavelengths varies with the temperature of the object. Hotter objects emit more light at shorter wavelengths than cooler objects.
On the other hand, stars with disks have a little “extra” energy coming out in the IR – that is light from the star that is absorbed by the dust around it, which heats up and re-emits in the IR. That’s the bottom two panels in the figure above. At Disk Detective, we have pre-selected all the objects you will look at so their SEDs show a little “extra” energy coming out in the IR.
Once you look at a bunch of SEDs, you develop a calibrated eye for what works as a star+disk and what doesn’t. So you might want to take a look at these examples to get a better feel for what SEDs can tell you.
Examples:
- The diagram above, with some more explanation: http://www.spitzer.caltech.edu/images/2632-sig05-026-The-Invisible-Disk
- Another diagram showing the effect of small dust grains on the SED: http://www.spitzer.caltech.edu/images/1179-ssc2004-08c-Spectra-Show-Protoplanetary-Disk-Structures
- SED from a white dwarf with a relatively large excess: http://www.spitzer.caltech.edu/images/2054-sig09-002-Emission-from-the-White-Dwarf-System-GD-16
- SED from a star with just a little excess: http://www.spitzer.caltech.edu/images/3282-ssc2010-07a-Spectral-Signatures-of-Planetary-Doom
Hope this helps at least a little.
Luisa Rebull (@lrebull)
