
Spectral Energy Distributions (SEDs)
@ geckzilla asked on Talk:
I’m unfamiliar with SED diagrams. Could someone give me a few pointers? I read the short paragraph on the science page so I get the gist but I was wondering what some specific examples as they pertain to this project might look like.
SEDs are an important tool for recognizing and understanding disks. So I thought I might copy over here the answer I put there, and expand on it a little.
SED is an acronym meaning “spectral energy distribution”. So, it tells you where the energy is coming out as a function of wavelength (that’s the spectral part) from the combined light of whatever you’re looking at. By plotting up the energy emitted by an astronomical object, we can compare at a glance the emissions across a broad range of wavelengths. Does most of the energy come out in the UV, optical, or in the IR? The answer to that question can tell us something about what the object is.
For Disk Detective, we hope what we are looking at is {star+disk+anything else nearby including background sources} but it may very well be the combined light of a galaxy. The bands shown in Disk Detective come from optical (SDSS, DSS), near-IR (2MASS), and mid-IR (WISE). You can make an SED out of whatever photometric or spectral data you have on any given object (as long as the data are calibrated).
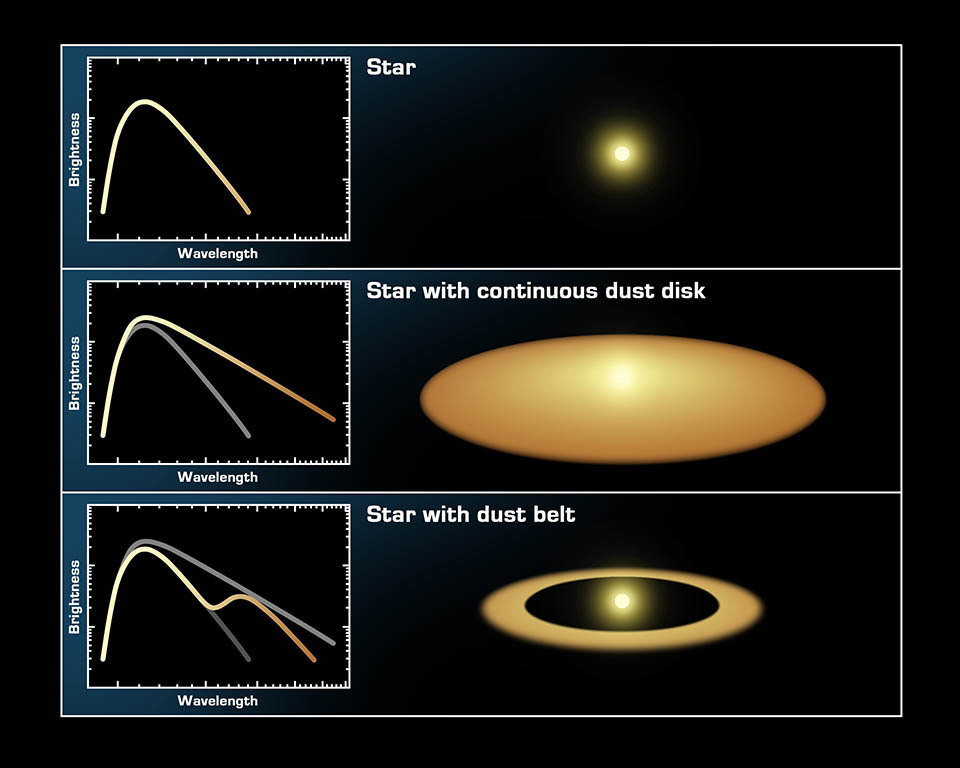
Stars without disks will look something like what physicists call a blackbody. That’s the top panel in the figure above. There is a mathematical description of this shape, but basically it describes the energy coming out from anything that is glowing due to heat – you, your toaster heating elements, an incandescent bulb, etc. The amount of energy emitted by an object at all wavelengths varies with the temperature of the object. Hotter objects emit more light at shorter wavelengths than cooler objects.
On the other hand, stars with disks have a little “extra” energy coming out in the IR – that is light from the star that is absorbed by the dust around it, which heats up and re-emits in the IR. That’s the bottom two panels in the figure above. At Disk Detective, we have pre-selected all the objects you will look at so their SEDs show a little “extra” energy coming out in the IR.
Once you look at a bunch of SEDs, you develop a calibrated eye for what works as a star+disk and what doesn’t. So you might want to take a look at these examples to get a better feel for what SEDs can tell you.
Examples:
- The diagram above, with some more explanation: http://www.spitzer.caltech.edu/images/2632-sig05-026-The-Invisible-Disk
- Another diagram showing the effect of small dust grains on the SED: http://www.spitzer.caltech.edu/images/1179-ssc2004-08c-Spectra-Show-Protoplanetary-Disk-Structures
- SED from a white dwarf with a relatively large excess: http://www.spitzer.caltech.edu/images/2054-sig09-002-Emission-from-the-White-Dwarf-System-GD-16
- SED from a star with just a little excess: http://www.spitzer.caltech.edu/images/3282-ssc2010-07a-Spectral-Signatures-of-Planetary-Doom
Hope this helps at least a little.
Luisa Rebull (@lrebull)
5 responses to “Spectral Energy Distributions (SEDs)”
Trackbacks / Pingbacks
- - February 15, 2015
- - March 5, 2015
- - September 21, 2023

Dear Luisa Rebull
Why we classify objects into just 6 classes?. In fact there are a long list of objects so sometimes I confuse where to put the object. so Gould you please give us a table to compare between the object type and the classification classes. in other words (What the philosophy of your classification system?).
Ah, you have put your finger on one of the weaknesses of this approach. Astronomers have long taken the approach of “let’s bin like with like in the hopes that it will give us physical insight into what is going on.” An analogy to this broad approach might be someone trying to figure out the large mammals of the world – initially, someone might put zebras in the same bin as tigers, because they’re both striped. Eventually, though, you might notice that their feet are different, and their teeth are different, and therefore maybe they shouldn’t be in the same bin. In the case of SEDs, we have chosen to parameterize (“put like with like”) based on the overall slope of the SED. But lots of things get swept under the rug with that approach – you may have noticed that SEDs can have lots of bumps and wiggles that get smoothed out if you just fit a line to the SED to place them in bins. In practice, you have to combine the shape of the SED with other things you know about the object – say, from a spectrum. If you have a spectrum, you can tell if it’s a galaxy or a star… and believe it or not, stars and galaxies can have very similar SEDs! So, in more explicit answer to your question, no, I can’t give you a table of SED shapes and a conclusive type of object .. there’s just too much variety and too many SEDs that can point to more than one kind of object. The philosophy of the classification system is to try to make sense of the chaos by weeding down 1000s of points into smaller bins that may (or may not) contain similar objects in the hopes that further study of the objects can shed light on their nature and the diversity found in any one bin.