
Examples of SEDs
As we discussed in an early blog post, the SED (Spectral Energy Distribution) is a plot of how bright an object is are as a function of wavelength. You can find each object’s SED on its Talk page.
Tadeáš Černohous (TED91) put together a wonderful collection of some of the different kinds of SEDs that you’re likely to encounter on Disk Detective. Nice work, TED91! Here it is for your delight. I added a few comments here and there. –Marc
Early Type Stars (Debris Disks)
These stars are as hot as the Sun or even hotter, and generally have spectral types B, A, F or G. (Type O is even earlier than that, but these very massive stars are rare.) The SEDs for these stars are nearly straight, downward-sloping, lines because of the Rayleigh-Jeans law. You’ll notice however that the very last point always falls slightly above the straight line; that’s because all the objects in Disk Detective were pre-selected for this property. This “infrared excess” is a sign that they might be surrounded by a disk, which glows only at these longer wavelengths.

AWI0006207, AWI00062ka, AWI00062aj, AWI0004y3p
Late Type Stars (Debris Disks)
These are stars of spectral type K or M, which are cooler and don’t emit as much at 1 micron as a the early type stars. You’ll see that the first point of the SED is a bit lower for these objects. The physics of this phenomenon is the Wein Displacement law; the peak of the blackbody curve shifts to longer wavelenegths for cooler objects.
Another effect that can cause the first few points of the SED to drop is interstellar “extinction” or more specifically, interstellar “reddening”. That’s when interstellar dust between the star and the Earth absorbs some of the light at the short wavelength end of the SED.

AWI0005cm2, AWI0005mue, AWI0005m8k, AWI0005ag0
More examples
Young Stellar Objects (YSOs)
YSOs generally have more infrared excess than debris disks, and the excess kicks in at shorter wavelengths, even as short as K band. Many YSOs are also reddened by interstellar dust. The SED’s of these objects sometimes may look similar to those of Active Galactic Nuclei (AGN) and dusty red giant stars; it’s hard to distinguish among them. If you aren’t sure which one it is, try to find some information on SIMBAD or VizieR.

AWI0005wau, AWI0002ddn, AWI0002p0g, AWI0005wal
Saturated stars
See that point at 3 microns (fourth point from the left)? It’s “lower” than it should be. That sometimes happens when the light from a bright object “saturates” the detectors in the WISE 1 band. Most often, when you see this in the SED, you’ll also see that the WISE 1 image looks very misshapen or displaced from the crosshairs. These objects are NOT good candidates.

AWI0005ywh, AWI0005yuk, AWI0005x81, AWI0005zgc
Galaxies
The spectral distributions for galaxies can contain several components: stars of different types as well as dust at various temperatures. Moreover, galaxies can be redshifted by the expansion of the universe, a process that shifts the SED to the right, sometimes even halfway across the plot. We aren’t interested in these objects in this phase 1 of Disk Detective, though we might be in the future.

AWI00009x3, AWI0000fsq, AWI00062j8, AWI0000an0
Quasars and Active Galactic Nuclei (QSO and AGN)
These objects may look like stars to you at first glance, because they often appear as a point sources of light. But these SEDs are clearly very different from those of stars. This is one of the ways SEDs can be useful! Quasars and AGN are also classes of objects we aim to discard in phase 1 of Disk Detective.

AWI00000t3, AWI00005z0, AWI00001hs, AWI00001m3
Planetary nebulae
Planetary nebulae have nothing to do with planets. They are clouds of gas and dust belched out by an old red giant star. These objects are fascinating–but for the purposes of Disk Detective they are trash.

AWI0002dbc, AWI0005duo, AWI00006ju, AWI00059t3
Please note that all of these are just some common examples. The SEDs may be different from case to case, especially when those objects are somehow contaminated or blended.
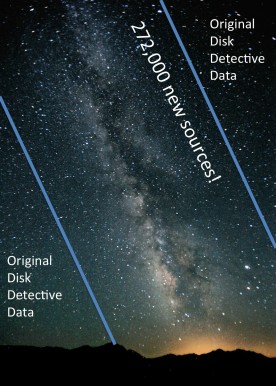
Good News Everyone! 272,000 More Subjects
January 28 we launched DiskDetective with a first batch of about 32,000 sources to classify. Of these, 20,000 have been in rotation at any given time. That’s a lot of astronomical data–and a lot of flipbooks to look at.

Well, it completely shocked us when we heard in March that some folks were seeing repeats–meaning that they had already classified more than 20,000 subjects! Now, we had always planned to have many more subjects than that in Disk Detective. But at that point, we were still in the process of downloading the data from the NASA/IPAC Infrared Science Archive onto a hard drive on Marc’s living room carpet, a process that took about a month. So we weren’t ready to put any more data online to keep all our detectives detecting.
The figure below shows the distribution of the J magnitudes of the sources with excess emission at 22 microns that WISE made really high quality images of (specifically ones from Southern Galactic latitudes, but that doesn’t matter). The total distribution, shown by the black curve, has two peaks, one around J=9, the other around J=16.
What is the meaning of these two peaks? Could it be two different kinds of sources?
The red and orange curves tell the rest of the story. The red curve shows the numbers for just those sources close to the Galactic plane. The orange curve shows the numbers for the remainder of the sources–those far from the galactic plane. Dividing the sources up in this manner shows that the second peak is mostly due to distant galaxies.
At low galactic latitude, dust from our Galaxy, the Milky Way, obscures most galaxies external to our own. So we know that the objects shown by the red curve–most of the peak at J=9–are stars (and maybe stars with disks). At high galactic latitude, the opposite is true. The objects shown by the orange curve should be mostly galaxies. That’s the peak at J=16.
For now, we’d like to skip the objects that are mostly galaxies (orange curve) and concentrate on the objects that are mostly stars (red curve). The orange and red curves cross at about J=14.5, so we decided to put aside the objects with J > 14.5 for now. That means this new batch of data should have fewer galaxies in it than the old batch–and more of those delicious disks!

What are we doing with the sources with J magnitude >14.5? Don’t worry, we’ll be putting them to good use. Our colleagues have suggested that hidden among those fainter sources could be Kardashev Type II and Type III civilizations. So once we’re done with this new batch of sources (roughly in 2017), we’ll start looking at the fainter objects–looking for signs of extraterrestrial intelligence. In fact–you may have already spotted some in the first batch of data. (They look just like debris disks and very red galaxies). Stay tuned!
Spectral Energy Distributions (SEDs)
@ geckzilla asked on Talk:
I’m unfamiliar with SED diagrams. Could someone give me a few pointers? I read the short paragraph on the science page so I get the gist but I was wondering what some specific examples as they pertain to this project might look like.
SEDs are an important tool for recognizing and understanding disks. So I thought I might copy over here the answer I put there, and expand on it a little.
SED is an acronym meaning “spectral energy distribution”. So, it tells you where the energy is coming out as a function of wavelength (that’s the spectral part) from the combined light of whatever you’re looking at. By plotting up the energy emitted by an astronomical object, we can compare at a glance the emissions across a broad range of wavelengths. Does most of the energy come out in the UV, optical, or in the IR? The answer to that question can tell us something about what the object is.
For Disk Detective, we hope what we are looking at is {star+disk+anything else nearby including background sources} but it may very well be the combined light of a galaxy. The bands shown in Disk Detective come from optical (SDSS, DSS), near-IR (2MASS), and mid-IR (WISE). You can make an SED out of whatever photometric or spectral data you have on any given object (as long as the data are calibrated).
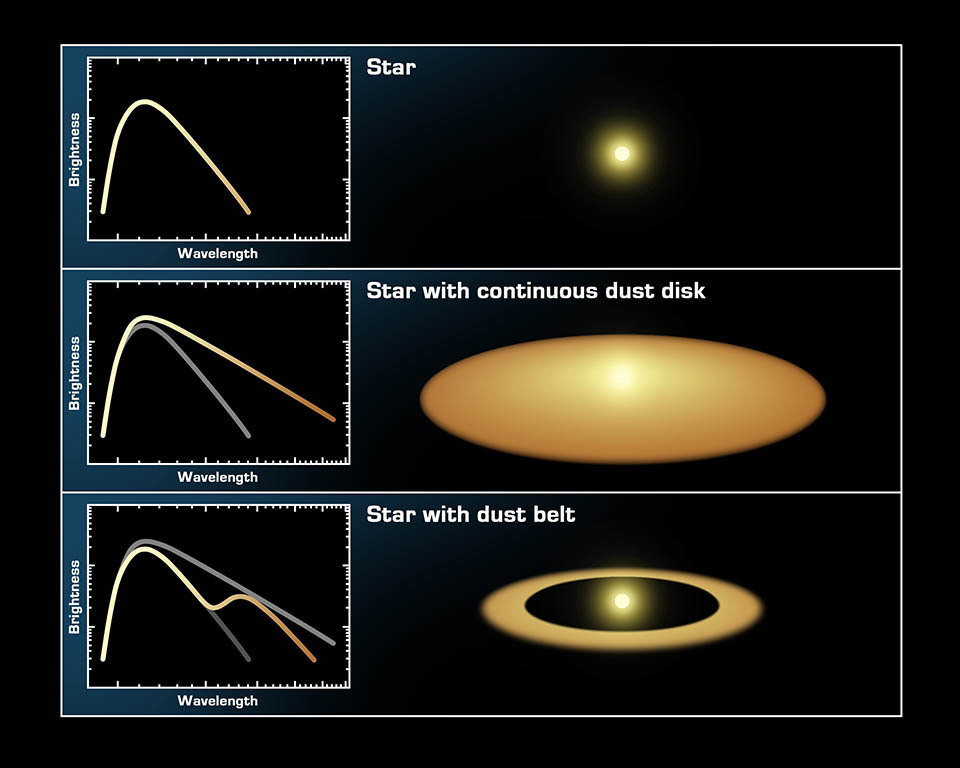
Stars without disks will look something like what physicists call a blackbody. That’s the top panel in the figure above. There is a mathematical description of this shape, but basically it describes the energy coming out from anything that is glowing due to heat – you, your toaster heating elements, an incandescent bulb, etc. The amount of energy emitted by an object at all wavelengths varies with the temperature of the object. Hotter objects emit more light at shorter wavelengths than cooler objects.
On the other hand, stars with disks have a little “extra” energy coming out in the IR – that is light from the star that is absorbed by the dust around it, which heats up and re-emits in the IR. That’s the bottom two panels in the figure above. At Disk Detective, we have pre-selected all the objects you will look at so their SEDs show a little “extra” energy coming out in the IR.
Once you look at a bunch of SEDs, you develop a calibrated eye for what works as a star+disk and what doesn’t. So you might want to take a look at these examples to get a better feel for what SEDs can tell you.
Examples:
- The diagram above, with some more explanation: http://www.spitzer.caltech.edu/images/2632-sig05-026-The-Invisible-Disk
- Another diagram showing the effect of small dust grains on the SED: http://www.spitzer.caltech.edu/images/1179-ssc2004-08c-Spectra-Show-Protoplanetary-Disk-Structures
- SED from a white dwarf with a relatively large excess: http://www.spitzer.caltech.edu/images/2054-sig09-002-Emission-from-the-White-Dwarf-System-GD-16
- SED from a star with just a little excess: http://www.spitzer.caltech.edu/images/3282-ssc2010-07a-Spectral-Signatures-of-Planetary-Doom
Hope this helps at least a little.
Luisa Rebull (@lrebull)
