Welcome to Disk Detective v2.0!
Hi, all:
As you may have seen over the past month, or from today’s email blast from Zooniverse, Disk Detective v2.0 is LIVE!!!!!
Here’s a rundown of some of the things you may notice are different now:
- We’ve moved onto the Zooniverse Project Builder. This means that it’s much easier for us to change out image sets as necessary (e.g. adding on objects that receive Gaia parallaxes), and it’s easier for us to update the project otherwise.
- Instead of using SDSS and DSS2, we’re using PanSTARRS and Skymapper for our images at visible wavelengths. These surveys have higher spatial resolution and probe deeper than SDSS and DSS2 do, so we’ll be able to see fainter background objects and multiple objects that are very close together.
- Instead of the AllWISE images, we’re using image coadds from unWISE. These images (which are also used to assemble the data for Backyard Worlds: Planet Nine) have better spatial resolution than the AllWISE atlas, which will let us detect background objects more easily in the WISE data. However, this data set comes with its own unique set of issues, which I’ll discuss below.
- We’ve added a new circle in the images. Much like the red circle in DDv1.0 (and the outer circle in DDv2.0) correspond to the W4 point spread function (PSF; how light spreads out on the camera chip), this circle corresponds to the 2MASS PSF. This lets us know if our 2MASS data has multiple objects blended together, which could indicate interesting phenomena like a binary system!
- We’ve added a new option for classification: “multiple objects in the inner circle.” This is to indicate that the 2MASS and WISE photometry data will have two stars blended within it, which could affect our detection of a disk.
As part of this, today we deployed a new subject set. This set has the same objects as the previous set, but with improved image processing of the unWISE images to correct for saturation of the chip. We will be using classifications from the previous data set, but thought it was important to get the improved processing uploaded as soon as possible.
Please try out DDv2.0 and tell us what you think! If you have feedback on things that need clarification, feel free to reach out to us on Talk. And keep following us here, and on Twitter and Facebook for updates on the project!
Our New Paper: “Peter Pan Disks”!
We recently had another article accepted for publication in the Astrophysical Journal! A pre-print is now available on arXiv. This one presents four new identifications of long-lived accretion disks around M dwarfs (like the object in our second paper), presents new data on the first one we identified, and uses these data to define a class of “Peter Pan” disk.
In 1904, J.M. Barrie wrote the play (and book) “Peter Pan, or The Boy Who Wouldn’t Grow Up,” about a boy Peter Pan who stayed the same age forever. It was later adapted into a stage musical and a Disney animated movie. Here, we use the term “Peter Pan” disk to describe disks that behave like planet-forming disks (they have lots of material, and are still accreting material from the disk on to the host star), but are 5-10 times older than the typical planet-forming disk; they seem to “never grow up.”
New Peter Pan Disks
To identify new disks, we cross-matched the Disk Detective catalog with the second data release from the European Space Agency’s Gaia mission, which is working to determine accurate distances to the nearest billion stars to the Earth. We then ran the cross-match through BANYAN Σ, a tool that uses Bayesian probability to estimate the likelihood that an object is in a young moving group based on its position, proper motion, and (if available) parallax and radial velocity. This turned up several matches, but two were of particular interest: AWI00063nx (J0949), and AWI000601p (J0446), which were apparent M dwarfs with strong excess in the Columba and Carina associations, just like the Paper 2 object. When we looked at the Gaia data, we found that each one was an apparent visual double–there was a second star so close by that we couldn’t detect it in our data! The systems still showed excess even after taking both components into account, as seen in the SED plots below.


We observed all four stars with the GMOS instrument on Gemini-South to determine their spectral type, estimate their radial velocities, and see if we found any spectroscopic indications of youth and/or accretion activity. We found that all four targets were M-dwarfs; the two components of J0446 were both M6 stars, while J0949 is made up of an M4 and and M5. All of them show broad emission from the hydrogen spectral line at 656.3 nm, indicating accretion; J0949A also shows emission from the helium line at 668.3 nm, an additional accretion indicator. The spectra also show evidence of low surface gravity in the stars, an indicator of youth. Finally, the radial velocities we estimate from the data are consistent with moving group membership. Based on all evidence, these objects are young moving group members with disks.
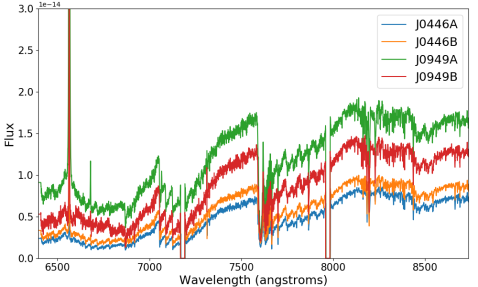
The spectra of the four new Peter Pan disks. All four are M dwarfs. The large dips are due to gaps in the camera chip on the spectrograph. Note the strong emission of the hydrogen H-alpha line at 6563 angstroms.
Characterizing Known Peter Pan Disks
In addition to identifying new disks, we also took more observations of the Peter Pan disks we already knew about. We analyzed light curves of J0808 (the Paper 2 object) with the 0.9-meter telescope at Cerro Tololo Inter-american Observatory (discussed in this blog post), and light curves of J0808 and J0501 (a published Peter Pan disk) from the Transiting Exoplanet Survey Satellite (TESS). From the light curves of J0808, we identified one bright flare, and noticed light curve variations that could be disk material blocking the light of the star.
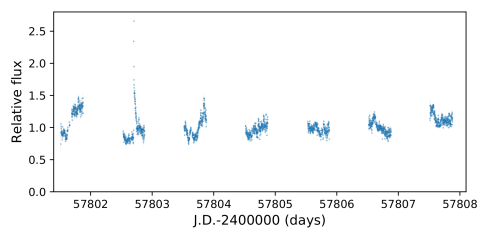
The CTIO light curve of J0808. Note the flare in the second night of data displayed.
In the TESS light curve of J0501, we saw clear periodic variations that closely follow the expected behavior for a persistent starspot or complex of starspots–like appear on our Sun, but covering more of the surface! While we didn’t see any disk occultations, we also detected a clear flare, and from published spectra and the period of the variations, we were able to determine that the system is inclined to our line of sight by ~38 degrees–enough that we wouldn’t expect the disk to go between us and the star.
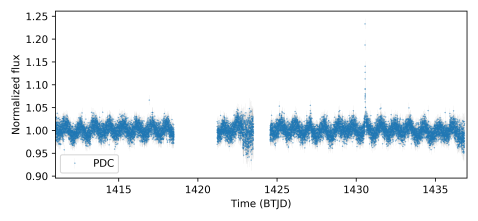
The light curve for J0501 from TESS. It shows clear sinusoidal behavior, and a flare at around Day 1431.
We also observed near-infrared spectra of J0808 from CTIO, as part of our M dwarf follow-up observations. We found that the spectrum varied on 24-hour timescales. Specifically, we saw variations in the Paschen-β and Brackett-γ lines. Like the Hα line discussed above, these are hydrogen spectral lines that trace accretion activity, but unlike Hα, they aren’t as affected by stellar activity (e.g. flares). These variations show clear evidence of accretion.
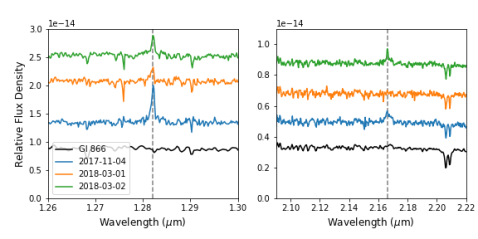
The Paschen-β and Brackett-γ lines of J0808 across three nights, with a non-accreting template for comparison. There are clear changes to the lines across each night.
What Makes a Peter Pan Disk?
What Makes a Peter Pan Disk? Using the characteristics we observed above, we found the following criteria:
- M-type or later spectral type star or brown dwarf
- With a Ks-W4 color >2, indicating a substantial warm disk
- At age >20 Myr
- With spectroscopic evidence of accretion.
Thus far, including the new objects presented here, there are seven Peter Pan disks known. While one of these might be an outlier, seven suggests a class of disk instead.
Why do these occur? There are several possibilities discussed in the paper; however, the most likely is simply that primordial disks around M dwarfs take longer to dissipate than their higher-mass counterparts, a trend observed in younger associations (e.g. the fraction of primordial disks is higher around M dwarfs than earlier-type stars in the Upper Scorpius association). This would mean that the timescale for planet formation around M dwarfs is longer than we previously thought, which could significantly affect the conditions of planetary atmospheres on these planets.
Next Steps
Our next steps are to characterize the known Peter Pan disks, and find more. We won time with the Chandra X-Ray Observatory to find X-ray fluxes for the known systems, which will give us information on the photoevaporation rates of these systems–it will tell us how quickly the stars’ energy evaporates disk material. We will also be doing some follow-up with the Magellan telescopes in Chile this June.
And we’ll be relaunching Disk Detective this year! We’ll be slightly changing the qualifications for including objects, with the goals of finding more Peter Pan disks. We’ll also be using the Zooniverse Project Builder interface, which will make tweaking the project over time easier. Look for a relaunch announcement in a few months!
The Disk Detective Database
We have a database! Thanks to a grant from the Space Telescope Science Institute, much of the Disk Detective science product is now available through the MAST archive.
What you’ll find there:
- Information on the classification data of individual objects from Disk Detective;
- Additional review information (literature review; more detailed examination) provided by members of the Disk Detective team;
- Cross-matches with Gaia, Pan-STARRS DR1, the TESS Input Catalog, and the APASS DR9 Catalog;
- Basic blackbody model SED fits to the observed data, with best-fit stellar effective temperature, disk temperature, and fractional infrared luminosity;
- Analysis of subjects from a convolutional neural network trained on Disk Detective classification data.
For more details on the information contained in each column, see below.
Original Selection Criteria
The original selection criteria to be included in Disk Detective were as follows (from Disk Detective Paper 1):
- w1mpro > 3.5 — WISE1 magnitude >3.5
- w4mpro < (w1mpro – 0.25) — WISE4 excess of 0.25 magnitudes over W1
- w1mpro > 5*sqrt((w1sigmpro*w1sigmpro)+(w4sigmpro*w4sigmpro)) + w4mpro — The W4 excess is significant at the 5-σ level
- w4sigmpro is not null and w4rchi2 < 1.3 — W4 profile-fitting yielded a fit with χ-squared < 1.3
- w4snr >=10 — W4 profile-fit signal-to-noise ratio > 10
- w4nm > 5 — Source detected at W4 in at least 5 individual 8.8s exposures with SNR > 3
- na = 0 and nb = 1 — The profile-fitting did not require active deblending
- n_2mass = 1 — One and onely one 2MASS PSC entries found within a 3″ radius of the W1 source position
- cc_flags[1] not matches “[DHOP]” and cc_flags[4] not matches “[DHOP]” — No diffraction spike, persistence, halo, or optical ghost issues at W1 or W4
- xscprox is null or xscprox > 30 — No 2MASS XSC source <30″ from the WISE source
- ext_flg = 0 — Photometry not contaminated by known 2MASS extended sources
Identifiers and Classification Data
The two primary identifiers used in the database are:
- designation: AllWISE ID
- ZooniverseID: unique ID for each target used in the Disk Detective back end
The raw classification data is broken into six categories, corresponding to the six options selectable by citizen scientists on the Disk Detective Web site. A screenshot of the classification page is shown below for reference.
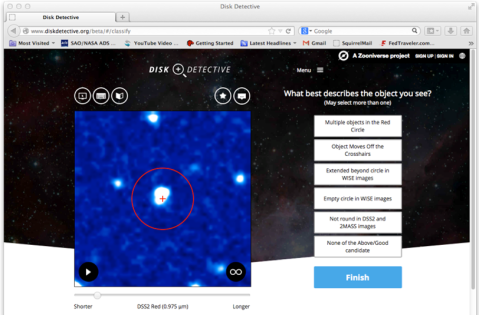
- good – “None of the Above/Good candidate”
- multi – “Multiple objects in the Red Circle”
- shift – “Object Moves Off the Crosshairs”
- extended – “Extended beyond circle in WISE images”
- empty – “Empty circle in WISE images”
- oval – “Not round in DSS2 and 2MASS images”
There are two other relevant status columns:
- classifiers – number of times a citizen scientist clicked “Finish” on a subject
- state – status on the website as of April 30, 2019
In addition, there are several “Fraction” columns (goodFraction, multiFraction, etc.). These are simply the number of votes in a category, divided by the number of classifiers for that object. So goodFraction = (good)/(classifiers), etc.
Vetting and literature review
In addition to classifications, we have a detailed literature review and re-evaluation by the team. The information from these is stored in three columns:
- flags – Objects flagged as having certain characteristics
- SciTeamFollowUp: whether or not we think the object is worth following up
- SciTeamComment: detailed comments explaining the decision in SciTeamFollowUp, including other literature references
Machine learning
Using Disk Detective classification data as a training set, we constructed a convolutional neural network to analyze Disk Detective images. The most useful results from this are listed in the “majGood” column.
- majGood: quality rating from a neural network trained on Disk Detective data.
Cross-matches
There are several cross-matches from Disk Detective to other surveys. These columns are generally denoted by a lower-case letter before the column name from that survey. We list these surveys below to demonstrate what prefix corresponds to which survey.
- pXXXXXX = data from PanSTARRS DR1
- gXXXXXX = data from Gaia DR2
- tXXXXXX = data from the TESS Input Catalog
- aXXXXXX = data from the AAVSO Photometric All-Sky Survey.
SED fits
SED fits for all objects are calculated using a maximum-likelihood estimator, using SciPy’s built-in minimize function from the optimize package. These SED fits take in as inputs the Gaia, 2MASS, and WISE photometry, and fit two blackbodies to the data, one each for the star and disk. For objects with more than two points of excess, a power-law fit is also calculated.
To view the SED for an object, click the thumbnail image in the row for that object in your search.
Results from these fits are also listed in columns.
- Tstar: best-fit blackbody stellar temperature
- Tdisk: best-fit blackbody disk temperature
- lir_lstar: best-fit fractional infrared luminosity.
NOTE: These SEDs are provided solely as a first-look estimate, to determine if a disk model is physically feasible (helping discern e.g. a background AGN), and should be interpreted with caution. In particular, blackbody fits are non-ideal for stellar temperatures below ~4000 K.
Acknowledgements
We thank Bernie Shiao, Geoff Wallace, and Justin Ely for their contributions to producing this database at MAST. We thank David Rodriguez for his work in implementing the SED fitting algorithm. Finally, we thank the ~30,000 citizen scientists whose contributions examining images of these objects by eye make up the bulk of our science product. In particular, we recognize citizen scientist Hugo A. Durantini Luca for his time and effort in beta-testing the database for use by the Disk Detective team and the rest of the field.
Our New Paper is Out!
Good news, everyone: our latest paper from Disk Detective has just been accepted for publication in the Astrophysical Journal! You can read it on the arXiv now. In it, we estimate the number of disks we expect to find in Disk Detective, and present over two hundred new disk candidates that have received high-resolution follow-up imaging.
Disk Detective is designed to identify new disk candidates in the AllWISE catalog by eliminating false positives. Because we have such a large catalog and so many classifications that have been made so far (keep them coming!), we can get some statistics on how many objects are false positives, and use that to estimate the number of disks we expect to find. We can also break this down by what kind of false positive we find, and where in the galaxy we find it.

Objects as a function of Galactic latitude. Most objects are in the Galactic plane, and most of those objects are multiples.
In general, “multiples,” objects for which a majority of classifiers clicked “Multiple objects in the Red Circle,” are the most common type of object–more than 70% of the objects in the catalog! Only about 8% of objects are classified as “None of the Above/Good candidate” by a majority of classifiers. These occur most often in the Galactic plane, as you’d expect–if there’s more stars in the Galactic plane, you’d expect to get more disk candidates there. However, multiples become much more common in the Galactic plane, as well–the multiple fraction in the Galactic plane is over 70%!
We looked to see the multiple fraction (the fraction of objects in a given range that were multiples) as a function of Galactic latitude. We expected that these would be most common in the Galactic plane, and fall off as you got further away from it. We found instead that while for the most part this is the case, there’s an additional peak between -30 and -35 degrees Galactic latitude.


So we looked at the multiple fraction as a function of both Galactic latitude and longitude, as shown on this heatmap (brighter = higher multiple fraction), and found that most of those multiples outside the Galactic plane occurred at the same Galactic latitude as the Large Magellanic Cloud–we have multiples caused by stars in nearby dwarf galaxies, too.
In addition to the website classifications, we also review our objects in the literature to ensure that we’re not identifying things that are known to be non-disk sources (like background galaxies). This eliminates an additional 14% of our objects, the remainder of which becomes DDOIs.

Objects with high-resolution follow-up as a function of Galactic latitude. Unlike with the website classification data, there’s no significant difference between in and out of the Galactic plane.
We took high-resolution images of 261 of our DDOIs to see if we could identify faint background objects, fainter than would be detectable in our survey data but bright enough to produce a false positive at W4, using the Robo-AO instrument while it was at Palomar, and RetroCam on the Irenee R. Dupont telescope at Las Campanas Observatory in Chile. (I wrote about my observing experience at LCO here.) We included some volunteers from our advanced user team in the analysis of this data–they’ll have a blog post up on the details of what they did soon. Overall, we found that 244 of the 261 objects were good disk candidates once faint background objects were taken into account.
Combining all of these, we estimate that only 7.9% of all infrared excess candidates in AllWISE are or will be good disk candidates. That means that we expect to find 21,600 disks in AllWISE, almost double our original estimate!

Estimated false positive fraction for several surveys. Surveys that visually inspect the data (blue) have lower expected false positive rates than surveys that don’t (orange).
We were able to use our false positive rates to estimate how many false positives appear in published disk searches. Many surveys do a good job, but have some false positives due to objects only detectable in high-resolution imaging. Some larger searches, however, seems to be riddled with false positives, including the McDonald et al. (2014) and (2017) searches, and the Marton et al. (2016) search. These searches don’t include a visual inspection of the images, and thus are likely to have high rates of false positives due to multiples at the minimum.
We were also able to leverage the knowledge base of our Disk Detectives to analyze the M dwarf disk candidates of Theissen & West (2014). M dwarf disks are key targets, because very few have been found, despite the abundance of M dwarfs nearby. The advanced user team got together and found a way to analyze the targets as if they were Disk Detective objects (more on this in their blog post coming soon). We found that only 13 of the candidates from Theissen & West (2014) had high enough signal-to-noise for the Disk Detective methodology to apply. Advanced users found flaws with all thirteen, making all of them false positives.

An HR diagram of our candidates with parallaxes from Gaia. Color of each point indicates the disk temperature, while size of each point indicates the strength of the infrared excess. This plot shows that while most of our objects lie on the main sequence (like our Sun does), many others lie off of it. We think that most of the ones off the main sequence are primordial disks.
Finally, we presented a list of 244 disk candidates with follow-up high-resolution imaging, 213 of which are new discoveries by Disk Detective. These seem to be split evenly among debris and YSO disks, though some of those YSO disks could potentially be “extreme” debris disks, which are thought to result from collisions of terrestrial planets. We made some further interesting discoveries among these:
- We found that twelve of our new disks were in comoving pairs (that is, another star nearby to them has similar motion), providing further support to the hypothesis that warm circumstellar dust is associated with binary systems.
- We made the first identification of 22-micron excess around two stars that are known to be in the Scorpius-Centaurus young association, and identified known disk host WISEA J164540.79-310226.6 as a likely member of Sco-Cen, based on its motion through the sky. By identifying these targets as members of Sco-Cen, we give them likely ages, letting us put these on timelines of disk evolution.
- We found thirty-one disk candidates within 125 pc, including 27 debris disks. These are good targets for both direct imaging exoplanet searches, and spatially resolving the disk itself in scattered light–making these targets optimal for observation with the James Webb Space Telescope.
And there’s still more work to be done! We recently hit 76% complete (that is, 76% of all our targets have enough classifications to be retired from the website), but that leaves more than 60,000 excesses to evaluate with your help. We now know how many objects we’re going to find–now it’s our job to finish finding them.
Some Housekeeping, and My Trip on SOFIA
Hi, all. Steven Silverberg from the science team here. Rather than my blog posts appearing under Marc’s name, I’ll be writing on this name from now on. It should make the blog a bit easier and less confusing to read.
Two weeks ago, I was lucky enough to observe on the Stratospheric Observatory For Infrared Astronomy (SOFIA). Here’s a summary of what we did, and what it was like.
SOFIA is a 747 with a custom hatch in the back and a telescope mounted inside, allowing us to observe from 40,000 feet. That altitude is above the primary part of the atmosphere that blocks infrared light, which means the telescope can observe at wavelengths longer than the ones we see in our Disk Detective WISE data, but shorter than the submillimeter wavelengths we’ve observed at with the James Clerk Maxwell Telescope. This neatly fills in a gap in our SEDs, giving us a clearer picture of how dust is distributed in these systems.
Last SOFIA proposal cycle, we submitted two proposals, and one was accepted for “do if time” status. This proposal was to get 53 micron data on a set of our main sequence A stars, as well as those identified by other projects (such as Patel et al. 2014). Our first set of observations was scheduled for May 9-11, so John Debes from the science team (and Space Telescope Science Institute) and I flew to California to ride along.
The plane itself is pretty impressive. 747s are big.

SOFIA is a working plane, so everyone onboard is piped in to the comms system. Wearing a flight comms headset makes you look important.

Because they had space, I was given permission to ride along in the cockpit for takeoff. Unfortunately, our first flight had to be scrubbed before takeoff, due to issues with some of the engine gauges.
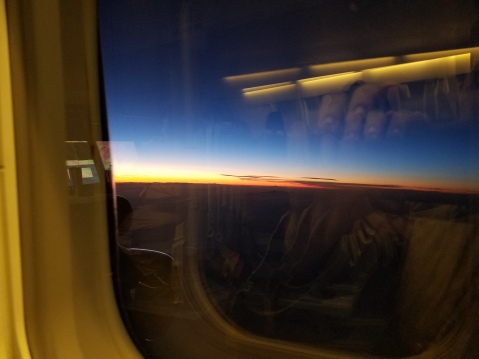
I did, however, get to ride in the cockpit for takeoff on the second night. Sunset is really pretty when looking through the windshield of a 747.


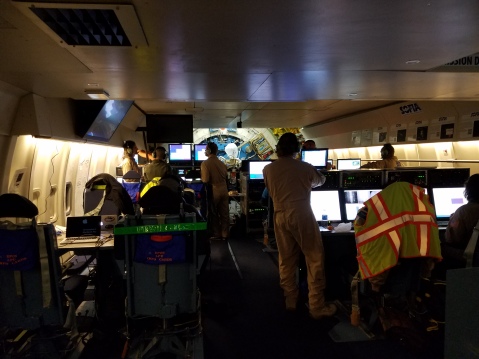
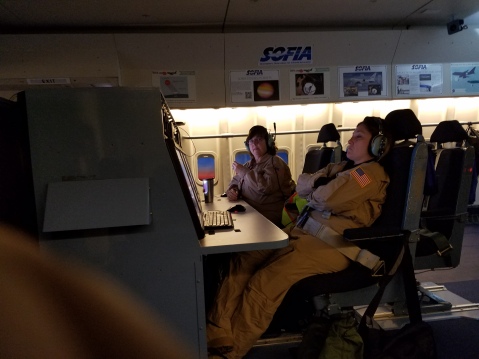
The main cabin of SOFIA feels a little bit like mission control; lots of people looking at lots of monitors, all in rows. On these flights, we had SOFIA flight safety crew, the mission directors, telescope operators, and the team that built the HAWC+ instrument we were using.
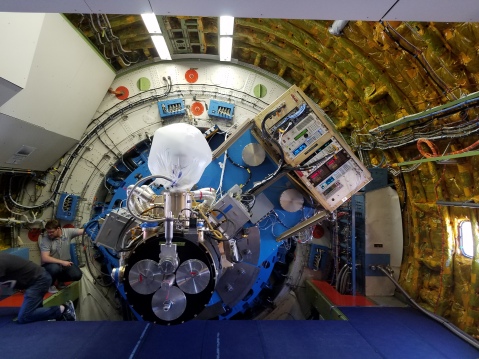
We proposed to look at objects with an instrument called HAWC+ (High-resolution Airborne Wideband Camera-plus). This is a far-infrared camera, designed to probe long wavelengths. If the detector is sensitive enough and our target bright enough, we would be able to see light from our star+disk systems to add another point to our SED for that DDOI, but at worst we can get upper limits on what flux there is, letting us at least constrain the system.
HAWC+ has to come into the cabin through the main doors of the airplane. It’s engineered to fit through with 1/8 of an inch of clearance on either side.
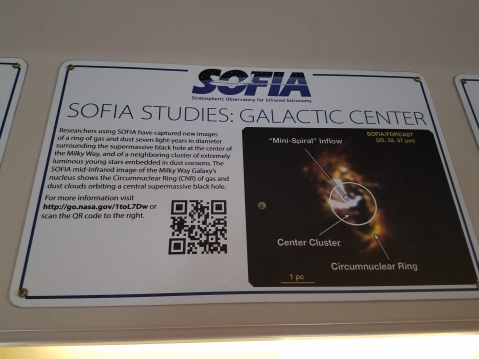
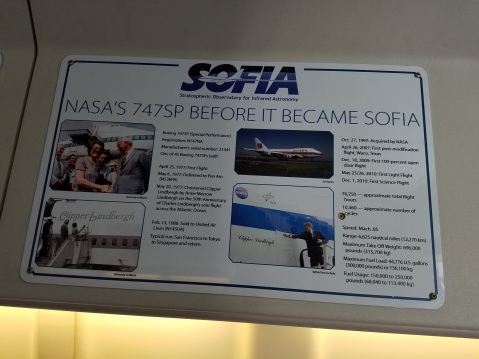
SOFIA helpfully has lots of posters along the bulkhead about how it works…


…and some of the science it does
It also has one about how NASA came to acquire the plane.
Sunsets were impressive through the regular windows, too.
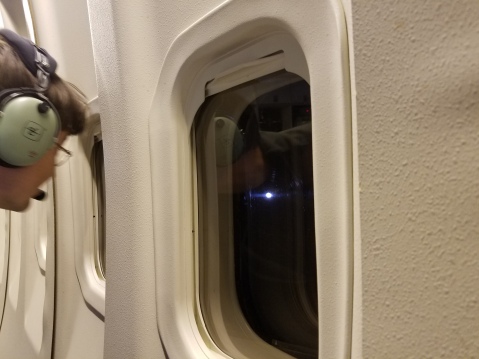
So was the Moon on our second flight.
Our last flight lasted long enough that the Sun was rising as we went into our descent.
The hangar the program is based out of is (unsurprisingly) huge.
All in all, it was a very educational, very informative, very fun trip on SOFIA. Thanks to you all for contributing to this project to make things like getting data from it feasible.